Custom Power BI dashboards that turn scattered spreadsheets, ERP exports, and CRM data into one live, decision-ready view of your business.
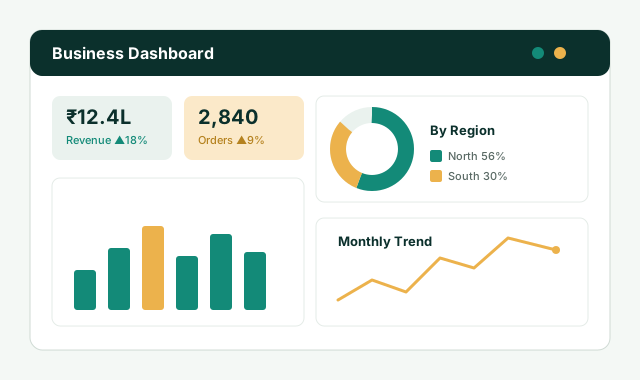
Static spreadsheets don't update themselves, and they break the moment someone changes a column. A properly built Power BI dashboard refreshes automatically, lets you drill from a company-wide number down to a single transaction in two clicks, and gives every stakeholder exactly the view they need — on a phone or a laptop.
Frozen as of the last manual update — no drill-down, no live refresh.
Data extraction, transformation, modelling, and visual design — from raw files to a finished product.
Proper relationships and structure so your dashboard stays fast and accurate as data grows.
Custom KPIs, YoY comparisons, running totals, and target-vs-actual logic as clean, reusable measures.
Connecting Excel, SQL, CRMs, accounting software, and ERP exports into one unified model.
Scheduled refreshes so your dashboard always shows today's numbers, not last month's.
Tailored dashboards for owners, sales heads, and branch managers — optimised for every screen.
We start with the decisions the dashboard must support — not just "what data do you have."
We assess your sources, quality, and structure, and flag gaps before building.
A clean, scalable model so future additions don't require rebuilding from scratch.
Visually clear dashboards focused on the 5–7 numbers that actually matter.
Every number cross-verified against source data before delivery.
A short walkthrough so your team can navigate, filter, and interpret with confidence.
Bring your data — we'll show you the dashboard your decisions have been waiting for.
Request a Free Dashboard Demo